Contents
- Intro
- The Starting Point
- What We Need
- Candidate Tech Stacks
- The Final Stack
- Further Improvements
- The End
Intro
For the past half a year, I’ve been working on building an experimental observability project — among many other tasks and projects — for infrastructure at my current company.
After trying out a few different tech stacks, I’ve settled on using ClickHouse for data warehouse and Grafana for visualizations and alerting.
This post is going to be a summary of this journey. It will give you a little insight on other tech stacks, and the reasoning behind the final choice.
Please note that this experience is highly subjective, so it may diverge from yours.
My little “research” started with this Reddit thread, but I couldn’t get answers optimal for my situation, so here we are, about 7 months later with a bag of experience 😁.
There are a lot more things I didn’t write about since it would take an eternity to finish this article. Grab something to drink and enjoy reading 🍵.
P.S. decided to make a slight edit on Elasticsearch section on Aug 25, 2025 just to make sure there’s as little misinformation as possible. Also, take a look at this comment on Hacker News with some critique of another part of this article, and my reply to it.
The Starting Point
Before getting into the new stack, it makes sense to tell you a bit about what we had initially.
Everything started with the Elastic Stack — EFK, more specifically. We used it to collect NGINX access and error logs, and cron jobs execution logs.
It was enough to create some basic visualizations with generic metrics calculated based on data from the logs, and to do some trivial full-text searching. But at some point we realized that it eats up almost 200 GB of disk space with the default compression codec just to store logs data of the past 14-15 days for a bit over a dozen of websites.
Not only resource-intensive, it was noticeably slow to calculate metrics, and quite inflexible in terms of data manipulation. Elasticsearch is a search engine, after all.
After trying out the DEFLATE codec, disk space usage reduced by a half, but with a query performance cost.

But Elasticsearch performance comes with horizontal scaling!
— you might say. Absolutely. Someone still needs to maintain this, and other resources usage doesn’t disappear. It runs on JVM.
Since I was the only one who operated this, there are two more subjective things that annoyed me: JSON API and Painless (the Elasticsearch scripting language).
The latter one is painful to use, and it lacks a coherent reference. At least, that was the case at the time. I don’t remember why exactly I wrote it this way, but there is a reference for this scripting language (probably just used wrong wording that might cause confusion for certain people; sorry if that’s the case).
The painfulness for me was that this language doesn’t have (yet) a way to debug it easily. Which means, I wouldn’t use it for writing somewhat complex logic. Pretty sure there are people who are pros at using it though.
I don’t like being forced to query and manipulate data using a JSON-based HTTP API instead of a DSL designed specifically for that purpose. It was painful not only because of this, but also because of some imperfections in the API documentation — don’t get me wrong, a lot of software has similar problems on the documentation side.
This stack was in operation for about a year or so, and despite the developers’ team lead being against its replacement due to his familiarity with it, I pushed the change. We must be prepared to collect data from all of our infra, not only websites. Observability is key to improvement.
What We Need
What we need is a cost-effective, vertically scalable bulldozer powerhouse made specifically for data crunching. Want to query logs? Here you go. Some metrics too? Come on, take them.
It has to have a powerful query language and be able to layout the data exactly how we want it without too much hustle. Preferably, a dialect of SQL, so that knowledge can be somewhat portable between tech stacks.
There must be a lot of integrations with other software for data ingestion and output.
As we are gradually refining our legacy infrastructure in pursuit to make it more maintainable and resilient, there’s a planned project for deployment of critical services in multiple distributed geographical locations. Therefore, the data warehouse for observability must either support replication, or high availability. Probably both.
ClickHouse satisfies all of the above. Yet, next you will find some information on other software considered before it.
Candidate Tech Stacks
Elasticsearch + Grafana
At first, I wanted to try out Elasticsearch with Grafana, because I was unsure about the future of this project. Maybe we could optimize the warehouse, and just use a more sophisticated visualization software.
As it turned out, Elasticsearch integration with Grafana has quirky limitations making it an unfeasible solution for some. Even in comparison with OpenSearch, an Elasticsearch fork by Amazon.
There’s no way to make it query data without grouping which is not always needed. See this issue.
Loki + Grafana
The next logical step was to try out a subset of the Grafana Labs’ LGTM stack.
I personally didn’t like it. Loki’s documentation was very lacking at some points when I last tried it half a year ago. It took a lot of time for me to figure out even basic things in terms of just setting it up.
It has a lot of moving parts, too. The setup can be tricky, especially if you know that you will need to scale in future.
For some reason, Grafana Labs change their supported data backends for Loki incredibly frequently. They get deprecated, and the new ones are added. At least, they provide means for seemingly adequate migration to the new ones.
Yet, this is unacceptable for a small team that needs stability in terms of frequency of change in the foundation of infrastructure, and cannot throw their resources at learning all the new data backends coming to swap out those in operation.
It seemed like the project is moving towards switching to s3 for data storage completely. s3 is good for storing certain types of data, and we are starting to migrate to it from NFS for storing backups in a more secure and comfortable way. Yet, I don’t like the idea of using it to store tons of small blocks of log data. That’s subjective, nothing more.
Loki’s query language, LogQL was very underdocumented at the time of trying this stack. It felt like one needs to learn Prometheus’ PromQL first — LogQL was inspired by it. This is unacceptable with limited human workforce.
When it comes to working with data, Loki should be thought of more like a distributed grep rather than a data crunching piece of software. It can help you find the exact events in the logs you need, and it’s really good at it. But if you need something more advanced, like severely transform data or calculate metrics based on logs, it gets painfully slow. The tool isn’t meant for that.
Timescale/InfluxDB + Grafana
This section is combined. It’s about Timescale and InfluxDB.
I didn’t try to spin up these two DBMSes to try out, but I read a lot of their documentation and other engineers’ opinions. Both of them have integrations with Grafana, as well.
Timescale
Timescale is an extension to Postgres. It’s designed specifically for working with timeseries data. If something has an integration with Postgres, you can use it with Timescale too. This is a DBMS I considered on par with ClickHouse, but chose the latter one due to its popularity — hence, more resources and community support by default.
I suggest you try this one when comparing different data warehouses. It should be a good experience.
InfluxDB
The free version with open source licenses doesn’t have clustering capabilities. An immediate no-no for our requirements.
But if you will use it, keep in mind that it uses Bolt as its data backend. The same Bolt used in the HashiCorp Vault integrated Raft storage and in etcd. Hence, it may need some maintenance too. More specifically, database compaction.
Here’s the full list of Bolt’s caveats and limitations.
SigNoz
My acquaintance with this project was brief. I set it up, played around with the interface, and didn’t like it. The community version had a lot of limitations as well, some of which got removed later. The project is still in its early stages, and I’m sure it is a perfect option for some people. Not for me, unfortunately.
The Final Stack
Log Collectors
To collect, parse, prepare data, and send it to ClickHouse, I use a combination of Fluent Bit and Vector. Later, rsyslog will be used as well.
Each of them is a good tool for a specific type of work, but not without their caveats, unfortunately.
Fluent Bit: The Good Parts
It is a simple and stable tool. You can rely on it. The documentation is there, and it’s enough most of the time.
Fluent Bit: Caveats
When you use Fluent Bit to collect data from a file, you use the Tail plugin. It doesn’t start collecting data until the file is changed. This can be a bit uncomfortable/nonoptimal in some environments.
Because of this, during tests, I used to manually touch(1) a log file, or append data to it.
Vector: The Good Parts
This tool is comfortable to use, and has an interesting approach to data collection and transformation.
It has a powerful data manipulation language, VRL. You use it to create small data parsing and modification programs. It gets compiled during Vector configuration load.
The language itself is really easy to use and has a familiar syntax inspired by Rust, sans all the complexity of the latter one.
It is a safe language by default, providing compile-time correctness checks. When some function can fail, you must handle this. Otherwise, the program won’t compile, and Vector won’t start.
When it comes to error messages, they are as good as Rust’s. Clear and concise, straight to the point, and with visual hints.
As an example, below you can see our current Vector config for collecting NGINX logs for all of the websites served by one of our reverse proxies.
sources:
  access:
    type: file
    include:
    - /var/log/nginx/access.log
    - /var/log/nginx/*/*access.log

  error:
    type: file
    include:
    - /var/log/nginx/error.log
    - /var/log/nginx/*/*error.log

transforms:
  nginx-access-parsed:
    type: remap
    inputs:
    - access
    source: |
      ._type = "access"
      ._message = .message

      parsed_data, err = parse_nginx_log(.message, "combined")

      if err == null {
        . |= parsed_data

        site_name, regex_err = parse_regex(.file, r'(?<value>[A-Za-z0-9:\.-]+)-(access|error)\.log$')

        if regex_err == null {
            .site_name = site_name.value
        } else {
            .site_name = "-"
        }

      } else {
        log(err, "error")
        ._message = string!(err) + ". Original message: \"" + string!(._message) + "\""
      }

      .timestamp = to_int(to_unix_timestamp(parse_timestamp!(.timestamp, "%d/%b/%Y:%T %z")))

      del(.source_type)
      del(.message)

  nginx-error-parsed:
    type: remap
    inputs:
    - error
    source: |
      ._type = "error"
      ._message = .message

      time, err = parse_regex(.message, r'^(?P<timestamp>[0-9]{4}\/[0-9]{2}\/[0-9]{2} [0-9]{2}:[0-9]{2}:[0-9]{2})')

      if err != null {
        log(err, "error")
      } else {
        .timestamp = time.timestamp
      }

      .timestamp = to_unix_timestamp(parse_timestamp!(.timestamp, "%Y/%m/%d %T"))

      site_name, regex_err = parse_regex(.file, r'(?<value>[A-Za-z0-9:\.-]+)-(access|error)\.log$')

      if regex_err == null {
          .site_name = site_name.value
      } else {
          .site_name = "-"
      }

      del(.message)
      del(.source_type)

sinks:
  clickhouse:
    inputs:
    - nginx-access-parsed
    - nginx-error-parsed
    type: clickhouse
    database: nginx
    table: '{{ ._type }}'
    endpoint: <REDACTED>
    batch:
      timeout_secs: 5
    auth:
      strategy: basic
      user: vector
      password: '<REDACTED>'
Vector: Caveats
Sometimes, it cannot properly parse data using special functions. NGINX error log parsing function is the one I had problems with. Because of that, I decided to not parse error logs. They get stored as-is.
In addition to that, Vector can lose some of your data read from a file with the File data source 🤪.
When that happens, records in ClickHouse look like the following:
{
  "timestamp": "2024-10-28 01:51:55",
  "_message": "function call error for \"parse_nginx_log\" at (59:96): failed parsing log line. Original message: \":51:52 +0300] \"GET / HTTP/2.0\" 301 162 \"-\" \"curl/7.68.0\"\"",
  "file": "<REDACTED>",
  "host": "<REDACTED>",
  "agent": "",
  "client": "",
  "compression": "",
  "referer": "",
  "request": "",
  "size": null,
  "status": null,
  "user": "",
  "site_name": "-",
  "_id": "<REDACTED>"
}
Take a look at this issue of mine that appeared to be a duplicate of this one which is still open since Nov 15, 2021.
I think, as a workaround, we’ll start to use Fluent Bit to collect data and send it to a centralized Vector instance for processing before ingestion into the warehouse.
Integration
Grafana has a quality integration plugin for ClickHouse developed with help from ClickHouse, Inc.
You can work with data as flexible as possible, the imagination is the limit, mostly. The full power of ClickHouse SQL dialect is at your disposal to crunch data and build visualizations with metrics.
Grafana natively supports all of the ClickHouse datatypes, and they can also be converted and transformed using Grafana’s data transformation tools.
To query data, a query builder can be used, or a query editor to write SQL code directly. I prefer the latter one due to the level of flexibility it provides.
The only problem I had with this integration is ad hoc filters. Sometimes, they don’t change what data is displayed on the dashboard if you use nested queries and lots of aggregations. I decided to not use these filters at all for that reason. It’s better to create a yet another variable if you need some specific filtering on a regular basis.
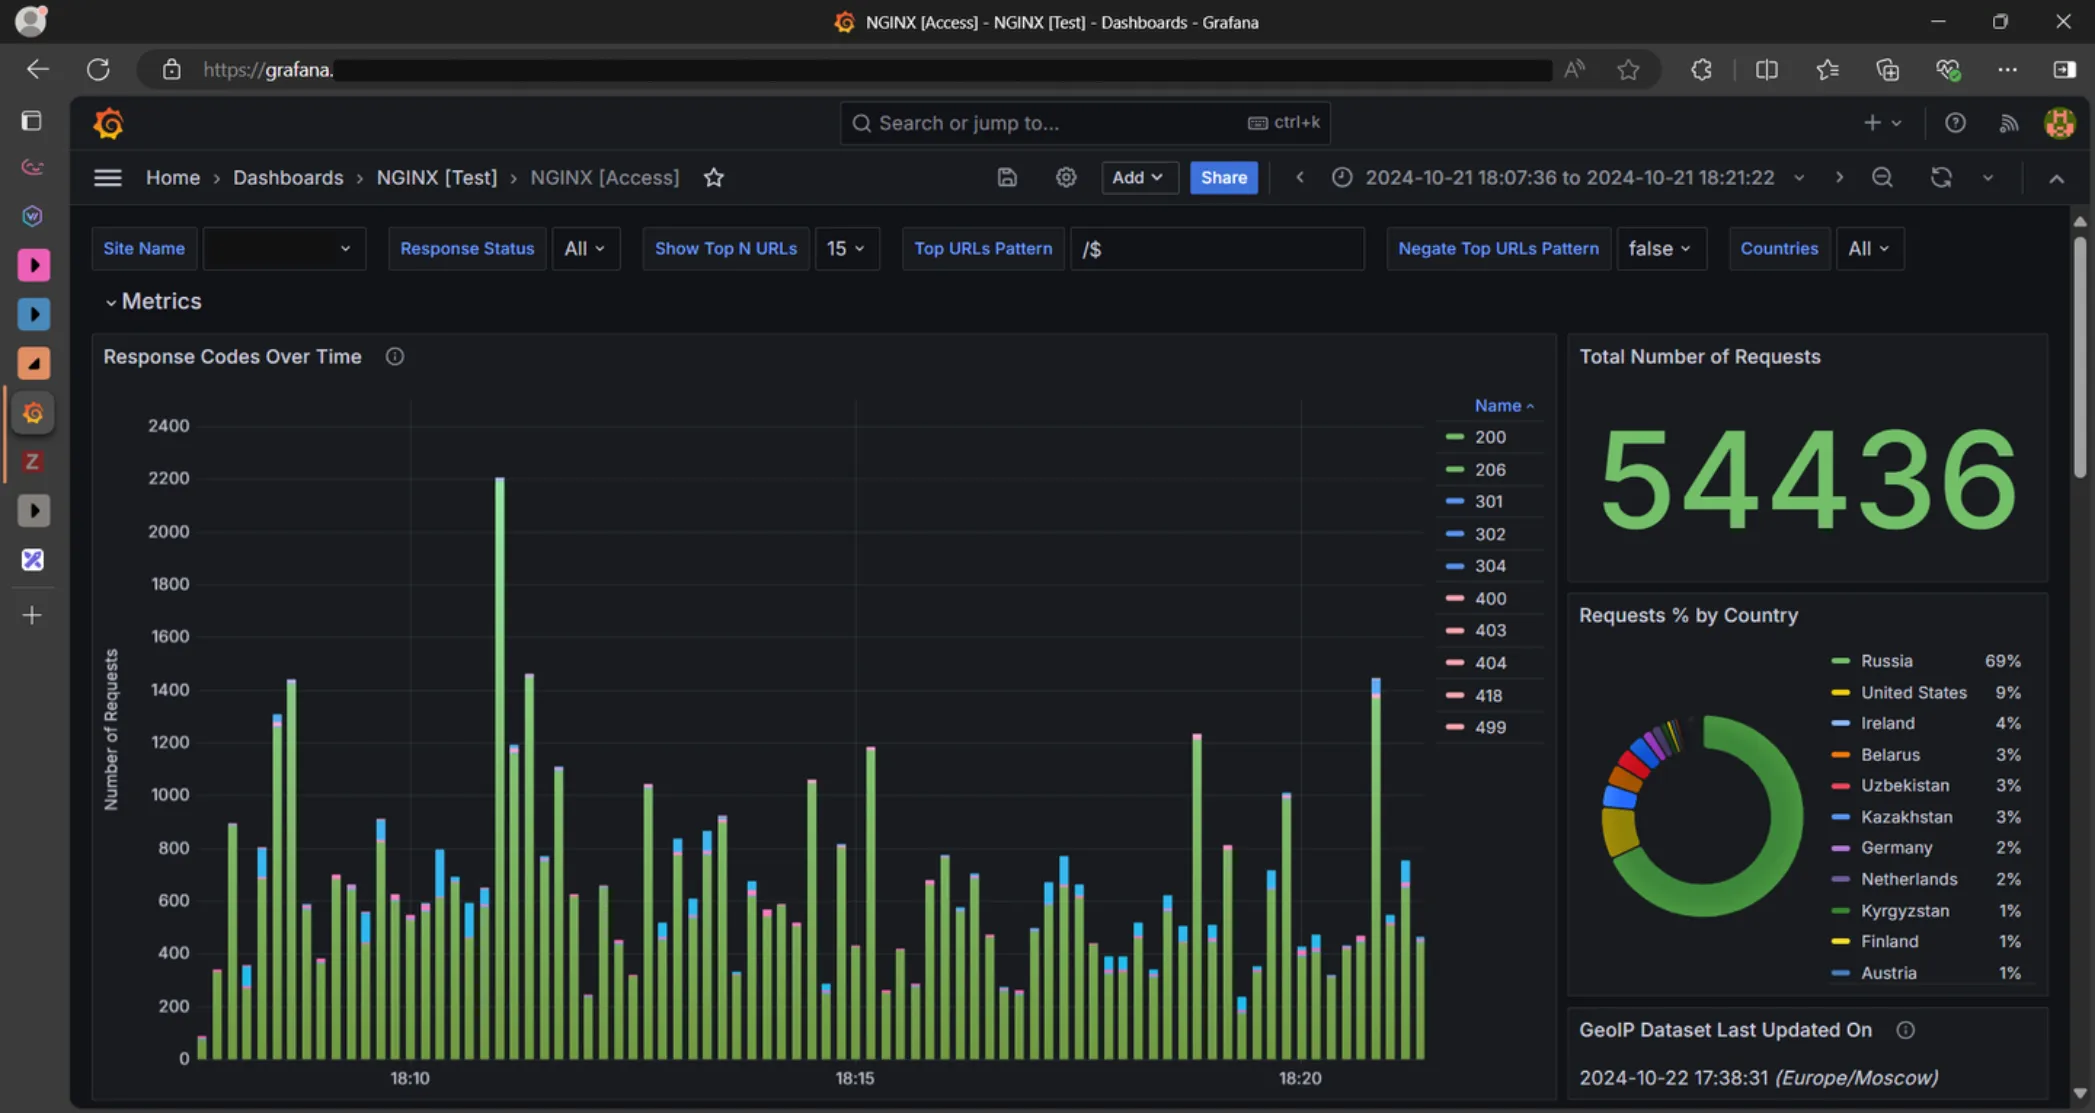
Let’s take a look at an example. If you recall the post banner image, it has a Response Codes Over Time visualization representing stacked HTTP response codes with variable binning for a chosen website.
Under the hood, it has the SQL query presented below.
SELECT
    time,
    sumMap(codes) AS combined_codes
FROM (
    WITH IPv4StringToNumOrDefault(client) as cli,
         dictGet('meta.geoip', ('country_name'), tuple(cli::IPv4)) AS country_name,
         array(${response_status}) AS _response_status,
         if(
             length(_response_status) = 1 AND has(_response_status, ''),
             array(),
             _response_status
         ) AS response_status,
         array(${countries}) AS _countries,
         multiIf(
            $__toTime - $__fromTime >= 31536000, INTERVAL 1 DAY, -- 1 year
            $__toTime - $__fromTime >= 2592000, INTERVAL 12 HOUR, -- 30 days
            $__toTime - $__fromTime >= 604800, INTERVAL 1 HOUR, -- 7 days
            $__toTime - $__fromTime >= 86400, INTERVAL 30 MINUTE, -- 1 day
            $__toTime - $__fromTime >= 21600, INTERVAL 5 MINUTE, -- 6 hours
            $__toTime - $__fromTime >= 7200, INTERVAL 1 MINUTE, -- 2 hours
            $__toTime - $__fromTime >= 2700, INTERVAL 30 SECOND, -- 45 Minutes
            INTERVAL 10 SECOND -- Default
         ) AS _interval
    SELECT
        toStartOfInterval(timestamp, _interval) AS time,
        map(status::String, count()) AS codes
    FROM
        nginx.access
    WHERE
        $__timeFilter(time)
        AND site_name LIKE '${site_name}'
        AND cli != 0
        AND if(
                length(_countries) = 1 AND has(_countries, 'ALL_COUNTRIES'),
                true,
                country_name IN (${countries})
            )
        AND status IN response_status
    GROUP BY
        time,
        status
    ORDER BY
        time
)
GROUP BY
    time
ORDER BY
    time;
What we get by executing the query above, is a two-column output with a timestamp and a Map(K, V) with status codes as keys and
their count as values.

By itself, this data cannot be fed to the timeseries visualization. The reason is, it works with columns of data only. One of the columns is a timestamp, and others represent data to be visualized.
ClickHouse JOINs may be limiting sometimes. For example, you cannot use arbitrary WHERE clauses with them. I encountered that when I was building the aforementioned visualization.
That’s not bad per se, it forced me to come up with a better solution to my problem. It took a couple of days brainstorming and whiteboarding since this is my first exposure to such databases with that type of problems.
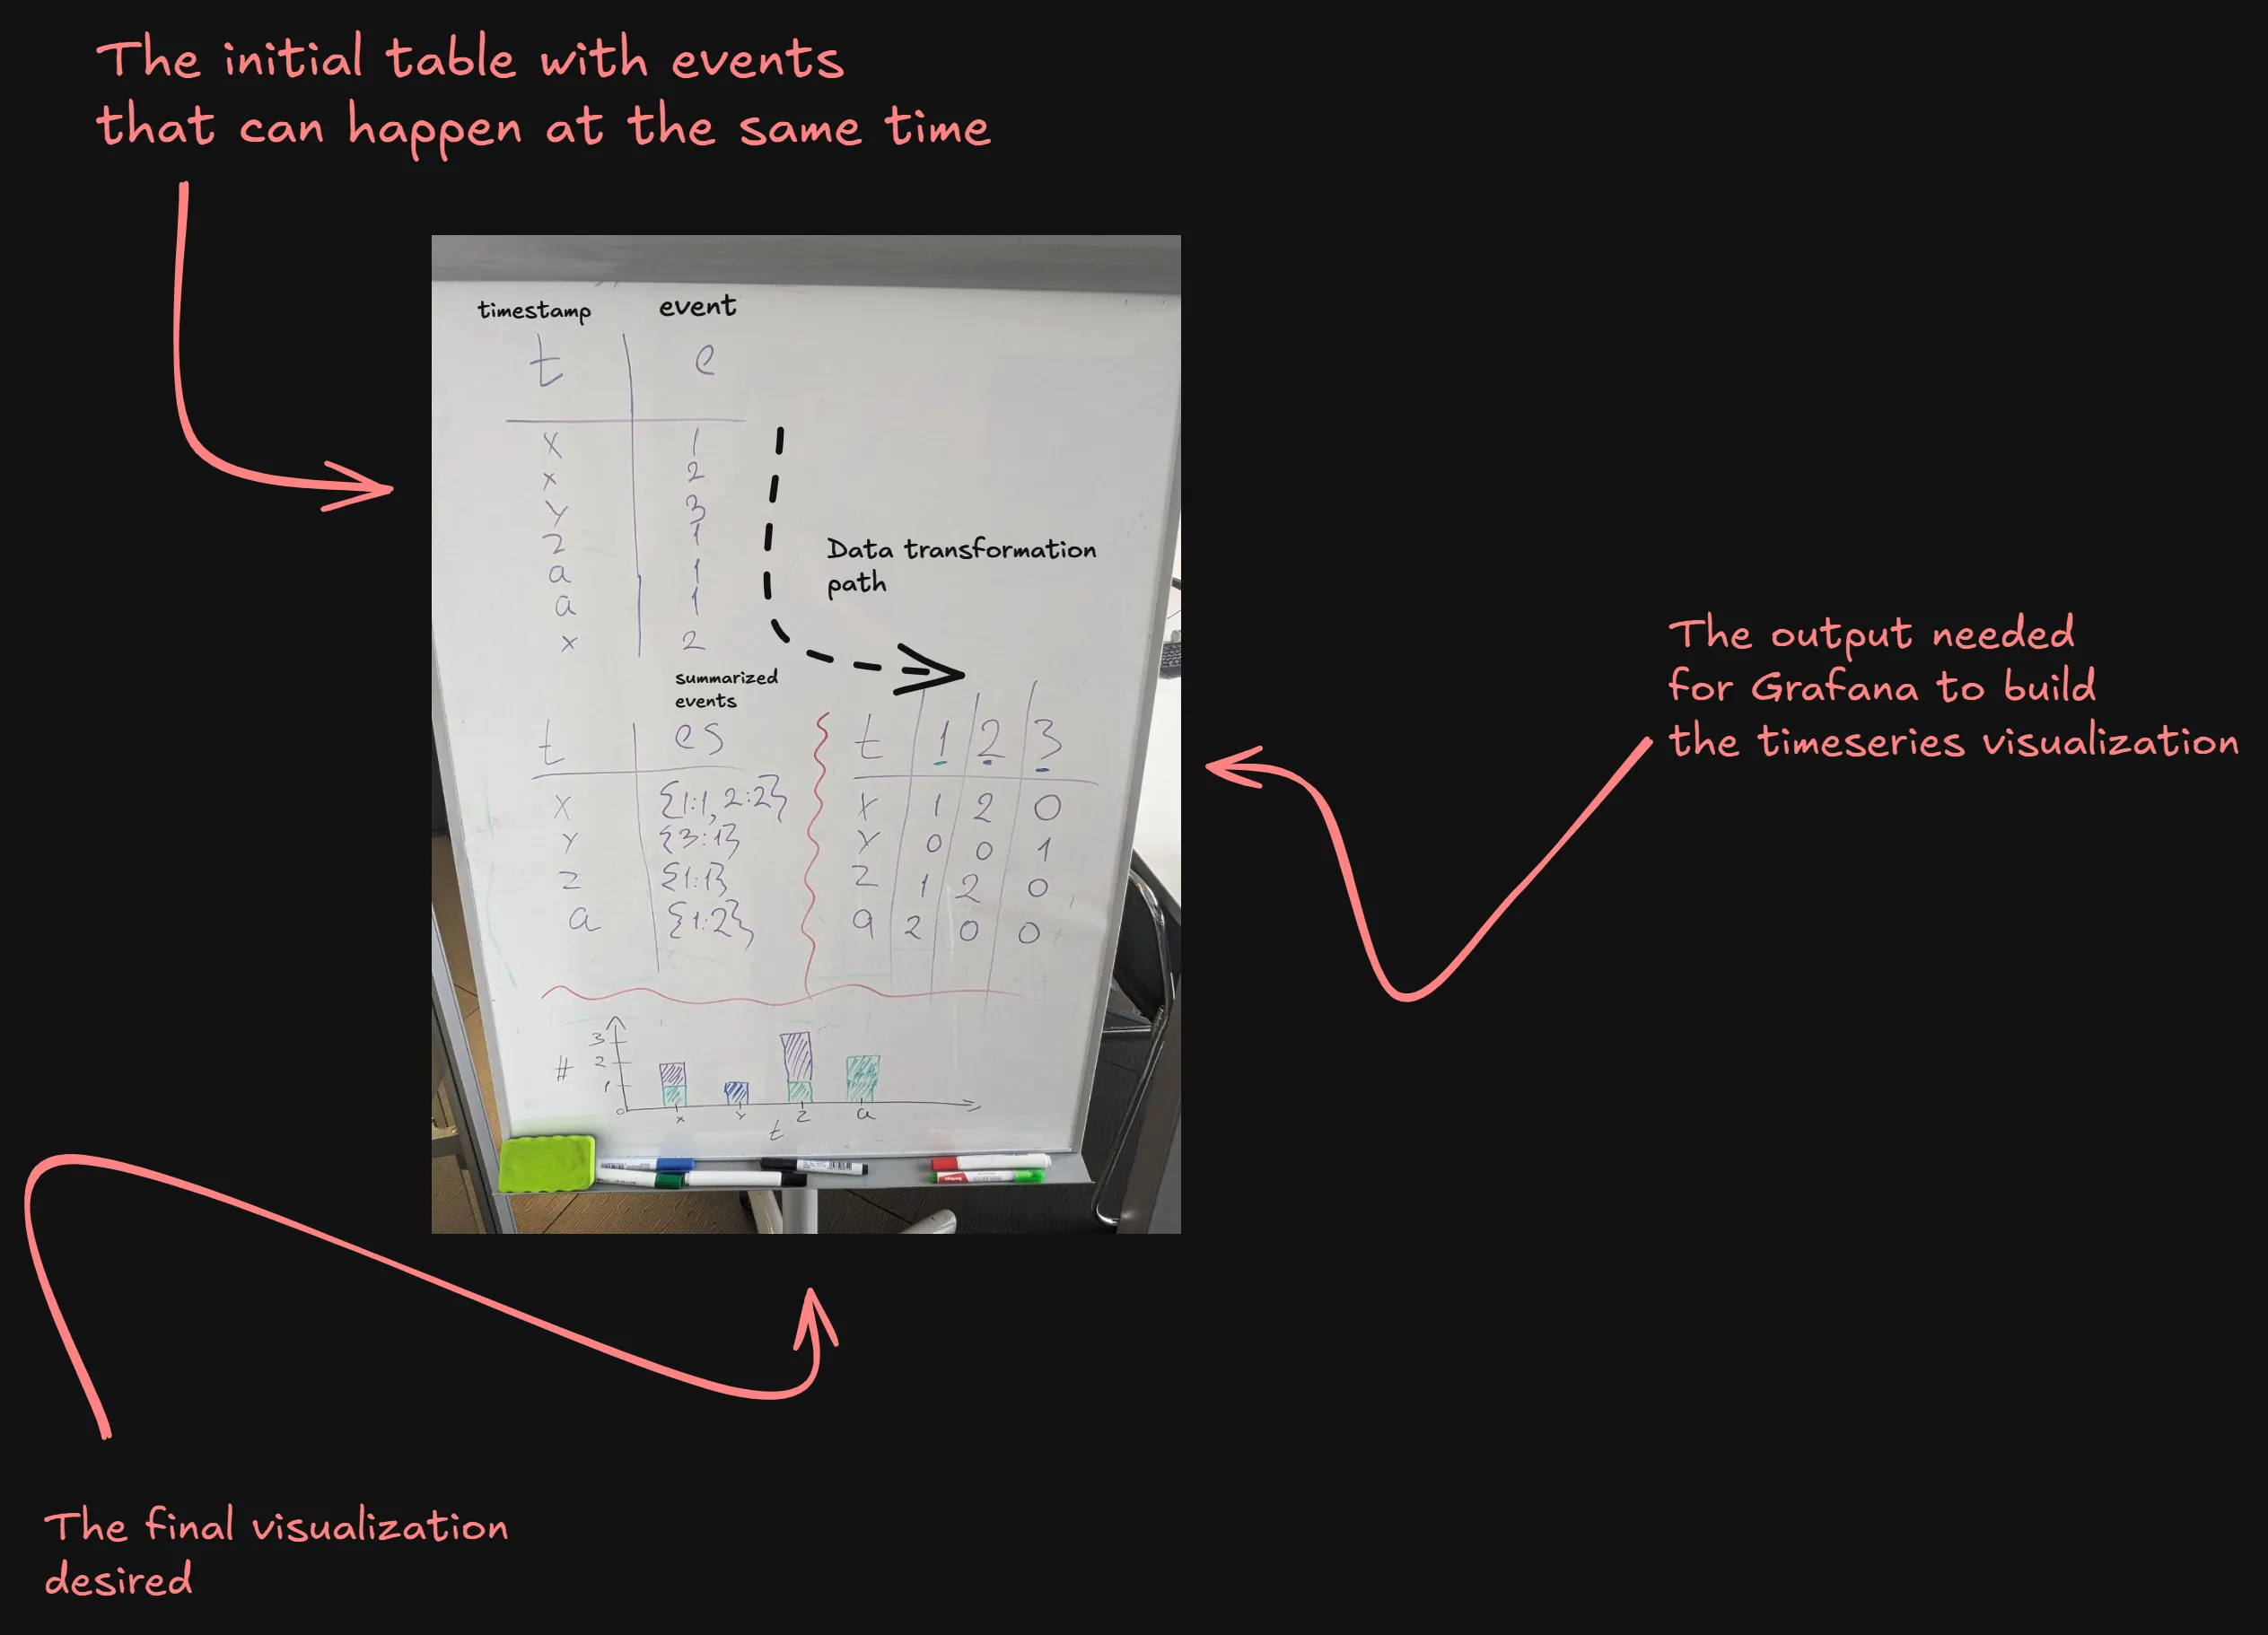
To make it work with the timeseries visualization type, first we extract the Map into separate columns using the Extract fields transformation.
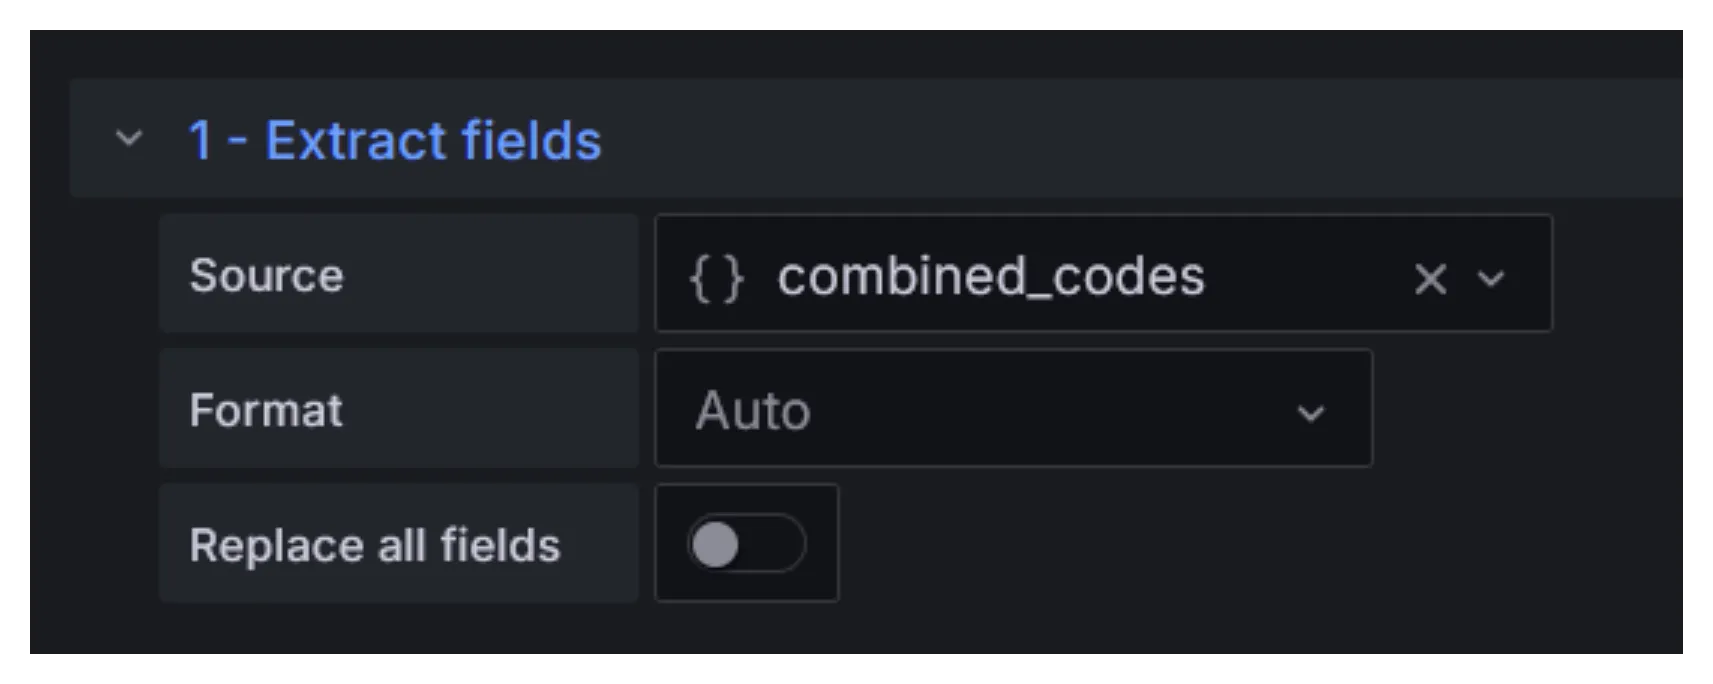
After that, the original column containing Map objects must be hidden. It’s no longer needed. For that, the Organize fields by name transformation can be used.
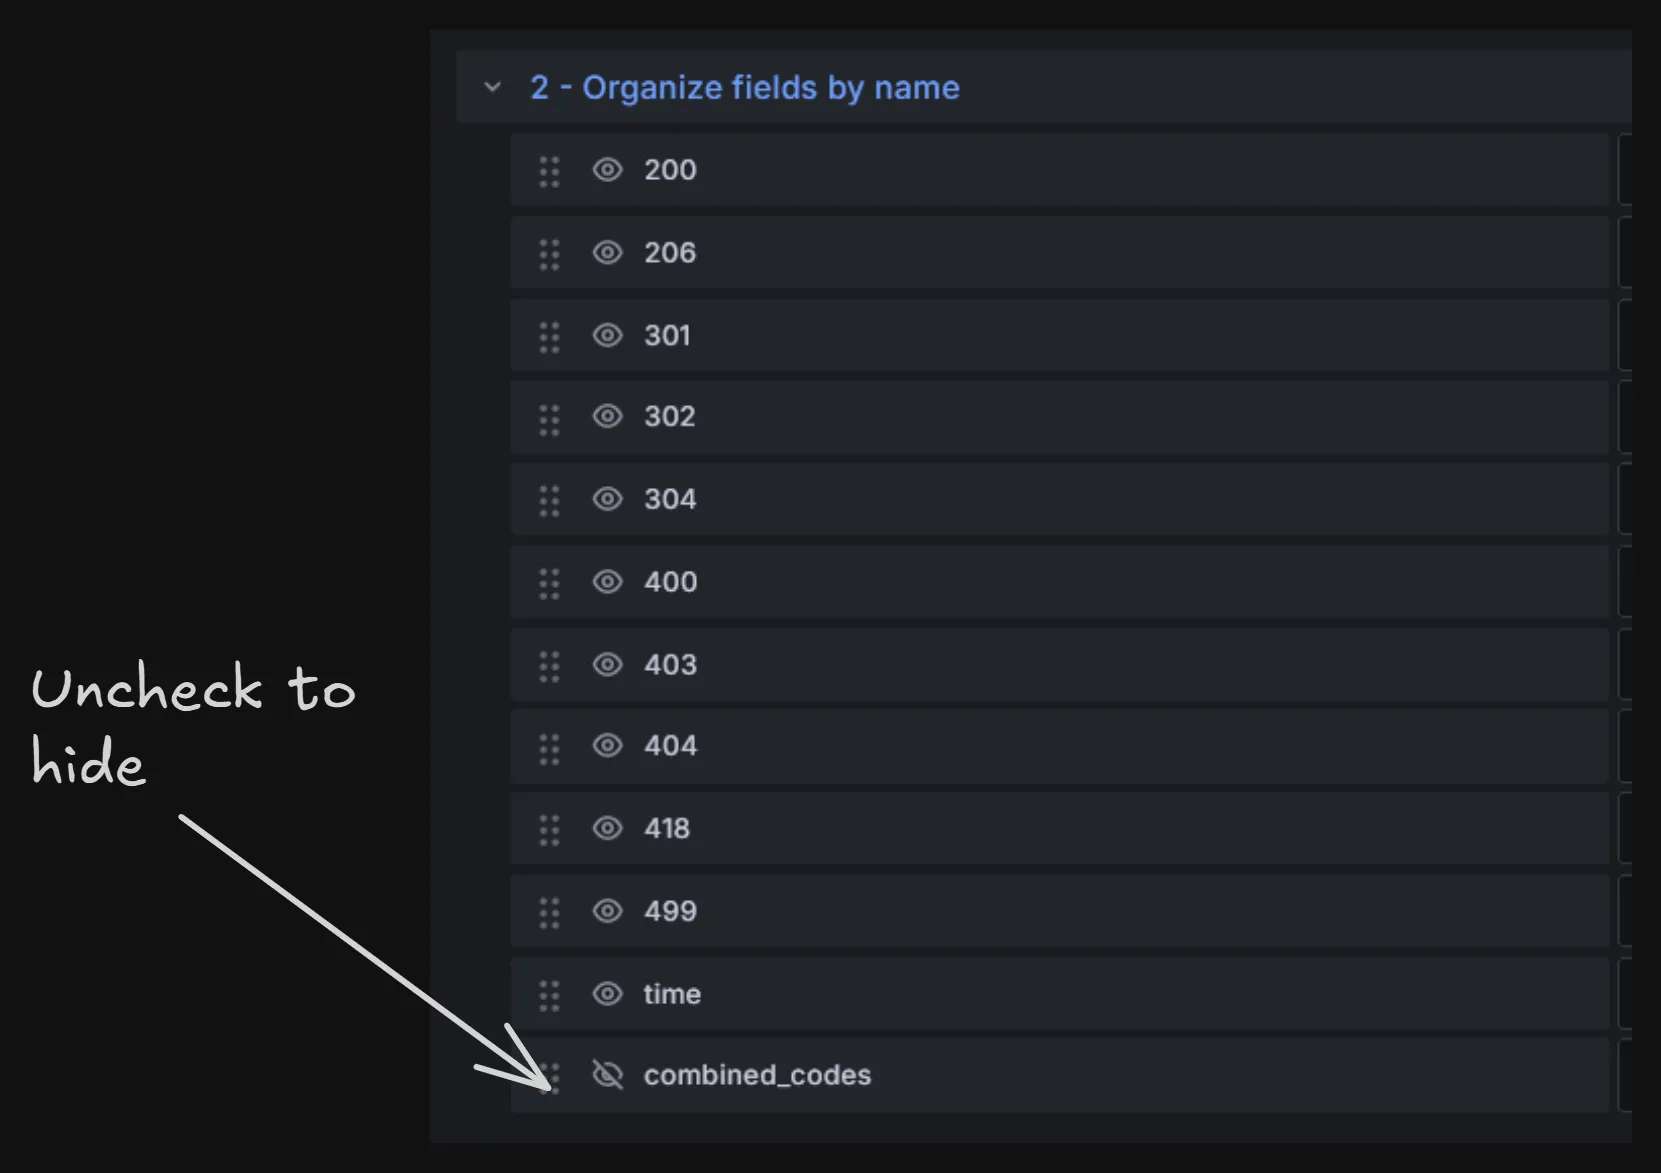
These modifications result in a table suitable for this type of visualization.

Wrapping Head Around New Approach
It may take some mental work to adapt to the approach of manually building and tuning both a data warehouse and a visualization layer for each of your log types.
As with everything new, it takes quite a lot of time, and trial and error. With every new visualization and dashboard, you gradually get better and faster at this.
My approach to laying out data and building dashboards comes down to several stages:
- “What should the data tell to our engineers?”
- “What data is necessary to extract and store for calculating metrics based on it,
and what can be inspected later in the original message stored next to it?”
Info
- Create a table schema in ClickHouse; think about data retention in advance, and pick an appropriate time period since it cannot be changed.
Info
- Create a couple of visualizations and use them.
- Depending on their usefulness, either remove or preserve them.
- Create new visualizations as needs change.
- As you encounter new ways the data can tell you more about your systems, keep refining the visualizations you already have.
- Designate time to maintain your dashboard in a clean state, it will pay off. Observe it from a user’s perspective:
- Do visualizations have clear names and descriptions?
- Are visualization types suitable for the kind of information you are trying to convey?
- Are colors confusing or just right?
Quirks
Any software has its quirks. Grafana and ClickHouse are a subject to this sometimes.
TTL
When I started using TTLs to configure data retention periods in ClickHouse, they didn’t work for some reason. This was fixed by updating the DBMS instance.
Broken Queries
After several more updates, all of my queries for an NGINX dashboard broke. This happened between versions v24.2 and v24.3 despite not having any breaking changes in the release notes. It took a lot of time to debug, and it turned out, outer CTEs stopped working with nested queries.
Since then, the visualizations’ queries have changed significantly because I get better at both Grafana and ClickHouse, and the NGINX access dashboard is starting to stabilize. Below you can take a look at the original query for one of the visualizations. It’s refined in the current version.
WITH IPv4StringToNumOrDefault(client) as cli,
     dictGet('meta.geoip', ('country_code'), tuple(cli::IPv4)) AS country_code
SELECT
    country_code,
    count() AS count
FROM
(
    SELECT
        client
    FROM
        nginx.access
    WHERE
        $__timeFilter(timestamp)
        AND site_name LIKE '${site_name}'
        AND cli != 0
        AND country_code IN (${countries})
    ORDER BY
        timestamp DESC
)
GROUP BY
    country_code
ORDER BY
    count DESC;
And here’s the diff with modifications I had to make:
1,2d0
< WITH IPv4StringToNumOrDefault(client) as cli,
<      dictGet('meta.geoip', ('country_code'), tuple(cli::IPv4)) AS country_code
7a6,7
>     WITH IPv4StringToNumOrDefault(client) as cli,
>          dictGet('meta.geoip', ('country_code'), tuple(cli::IPv4)) AS country_code
9c9
<         client
---
>         client, country_code
If you are interested, here's the current version
SELECT
    country_name,
    count() AS count
FROM
(
    WITH IPv4StringToNumOrDefault(client) as cli,
         dictGet('meta.geoip', ('country_name'), tuple(cli::IPv4)) AS country_name,
         array(${response_status}) AS _response_status,
         if(
             length(_response_status) = 1 AND has(_response_status, ''),
             array(),
             _response_status
         ) AS response_status,
        array(${countries}) AS _countries
    SELECT
        client, country_name
    FROM
        nginx.access
    WHERE
        $__timeFilter(timestamp)
        AND site_name LIKE '${site_name}'
        AND cli != 0
        AND if(
                length(_countries) = 1 AND has(_countries, 'ALL_COUNTRIES'),
                true,
                country_name IN (${countries})
            )
        AND status IN response_status
    ORDER BY
        timestamp DESC
)
GROUP BY
    country_name
ORDER BY
    count DESC;
Query Performance
The larger the data selection, the slower queries become. When you filter or aggregate over a large set of data — calculating metrics for a dashboard, or searching in logs during incident response — you will wait for ClickHouse to select the data you need.
To improve this for dashboards with metrics, wait until your visualizations stabilize in terms of their tuning and modification, and figure out perhaps some data used for their calculation should be extracted into separate columns, or even pre-calculated using materialized views. By doing so, you won’t be so hard on ClickHouse server’s hardware and your PC’s browser from the Grafana side.
The Power of Flexibility
Grafana
Not only Grafana has a handful of visualization types with abilities for data transformation, and dozens of useful plugins, it’s heavily customizable, and supports altering.
Markdown can be used in visualization descriptions for enhanced customization.
Several types of variables can be used for templating dashboards allowing to make them more dynamic.
They can be referenced in both visualization queries and their titles/descriptions providing more context to users.
To demonstrate the amount of flexibility available when building visualizations, let’s consider a couple of them
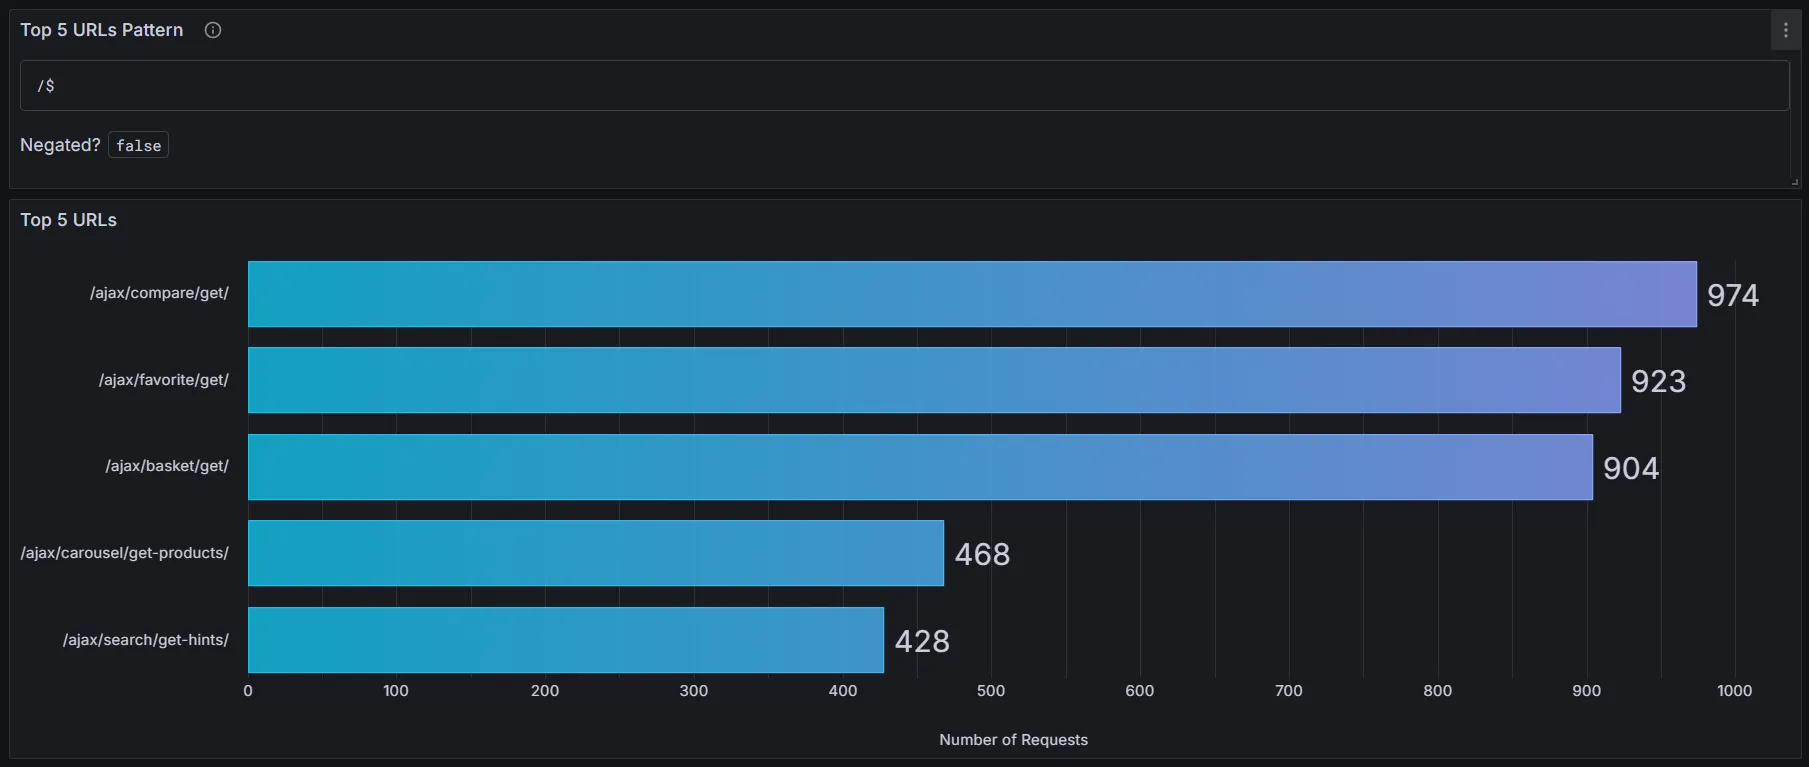
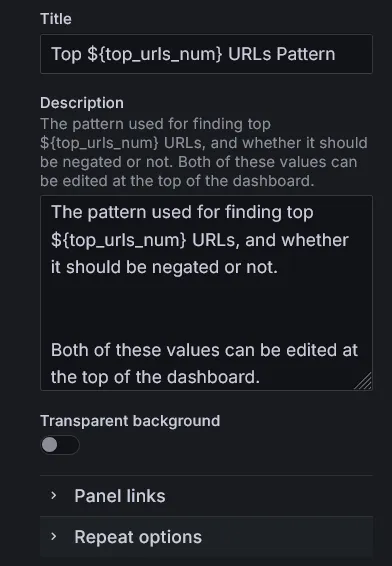
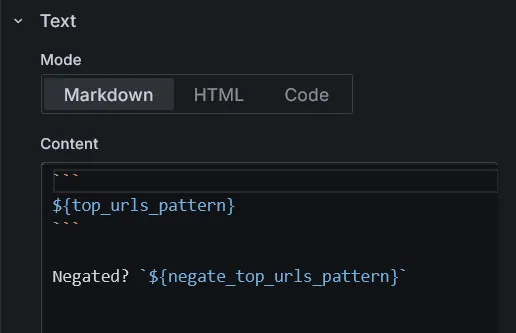
The Top N URLs Pattern and Top N URLs visualizations above use a variable top_urls_num to change titles, description, and query
based on user input at the top of the dashboard to eliminate confusion when analyzing data.
Take a look at the Response Codes Over Time visualization legend. The HTTP status codes are sorted by name in ascending order, and colored by range. 200s are green, 300s are blue, etc.
That way, it’s easy to analyze which status codes are present in a specific time range, and which are dominant.

Here’s a quick insight into how it’s colored and sorted based on data.
To achieve coloring based on status codes range, I used Grafana visualization overrides for fields matching regex.
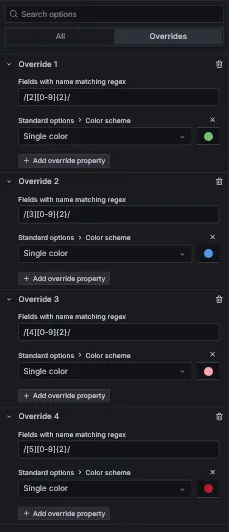
To sort status codes on the legend, its type should be set to table, and it must be sorted manually by clicking on the legend title. The order will be preserved on dashboard save.
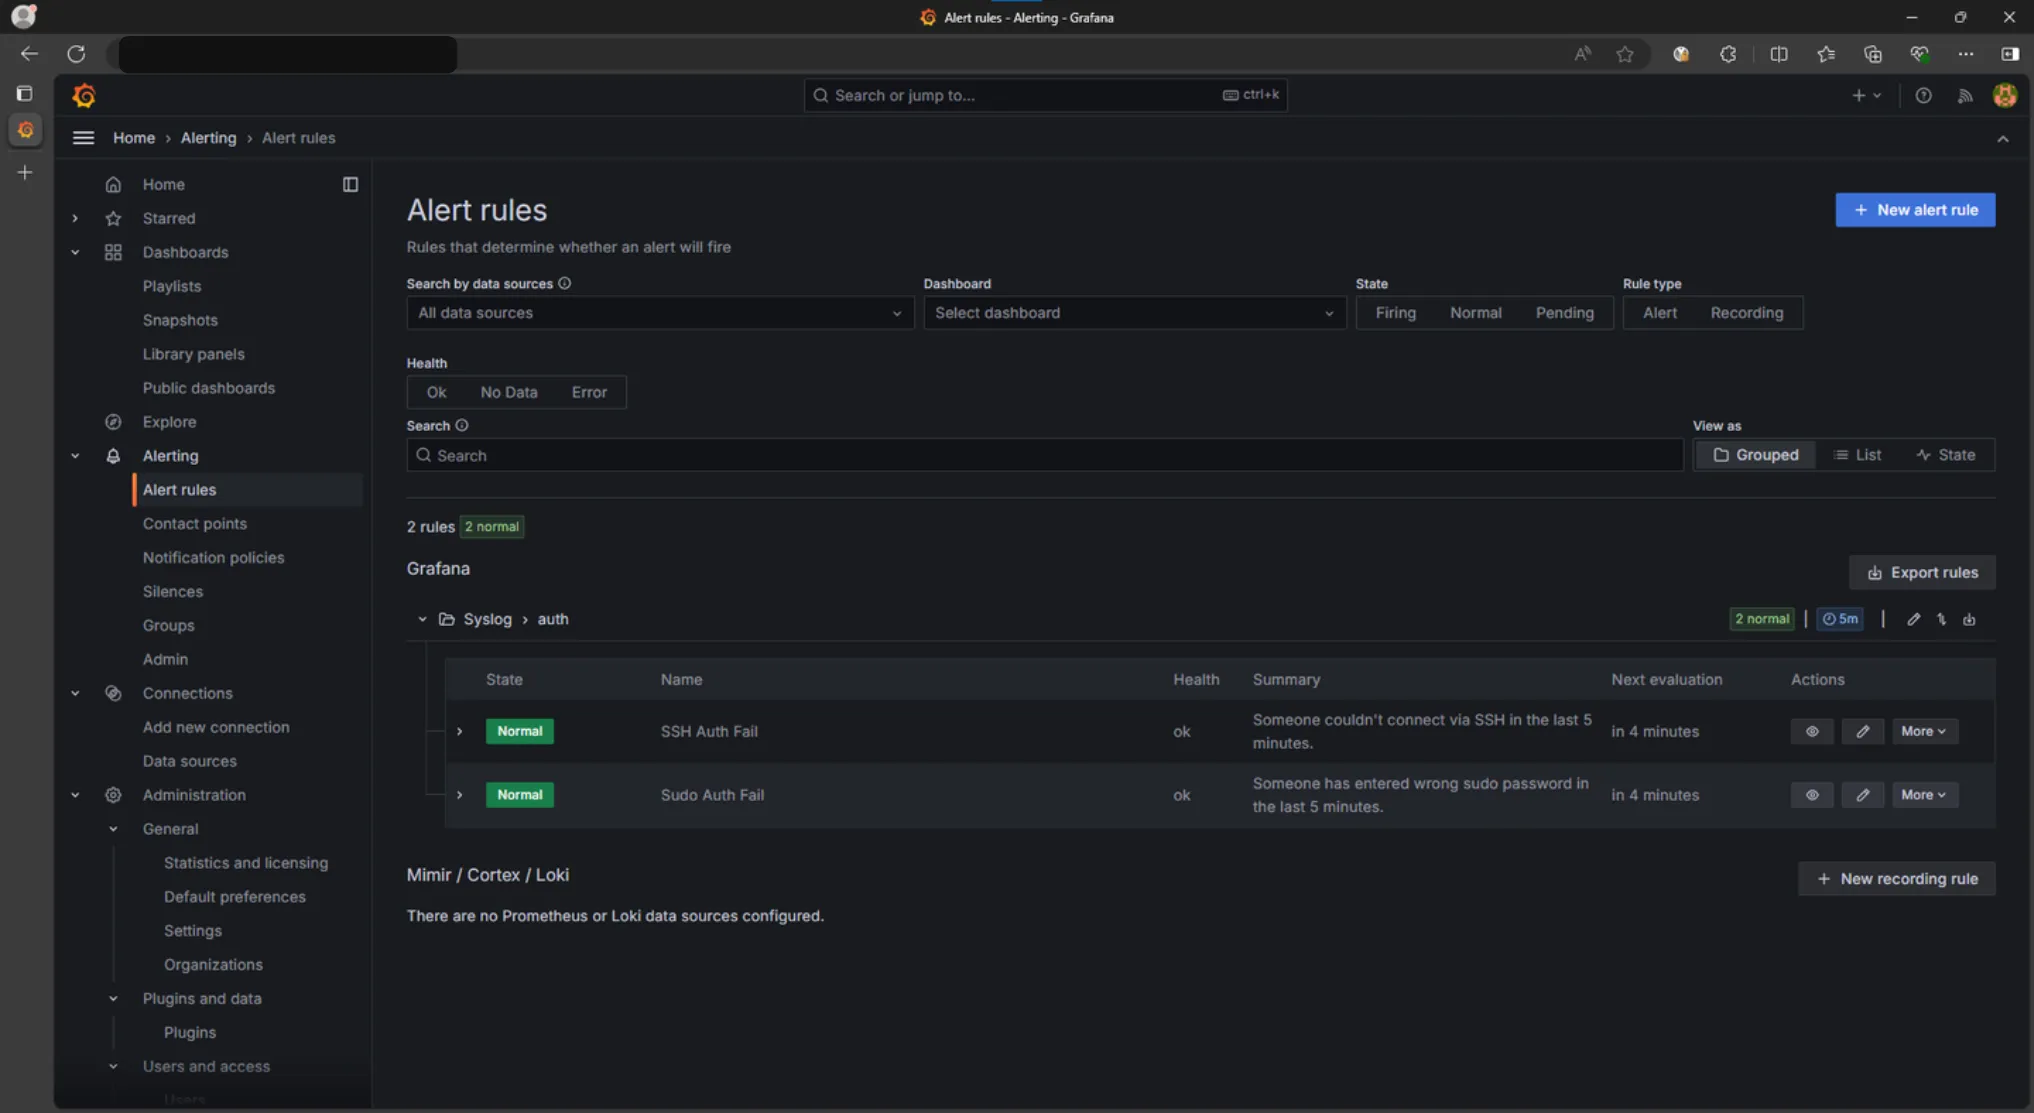
Speaking of Grafana alerting capabilities, this is a topic for a whole another article, so I won’t provide too much information here. Below is an example of a message from a custom Telegram bot connected to Grafana.
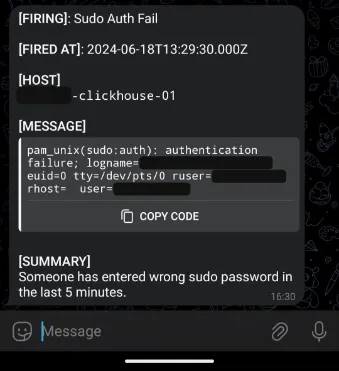
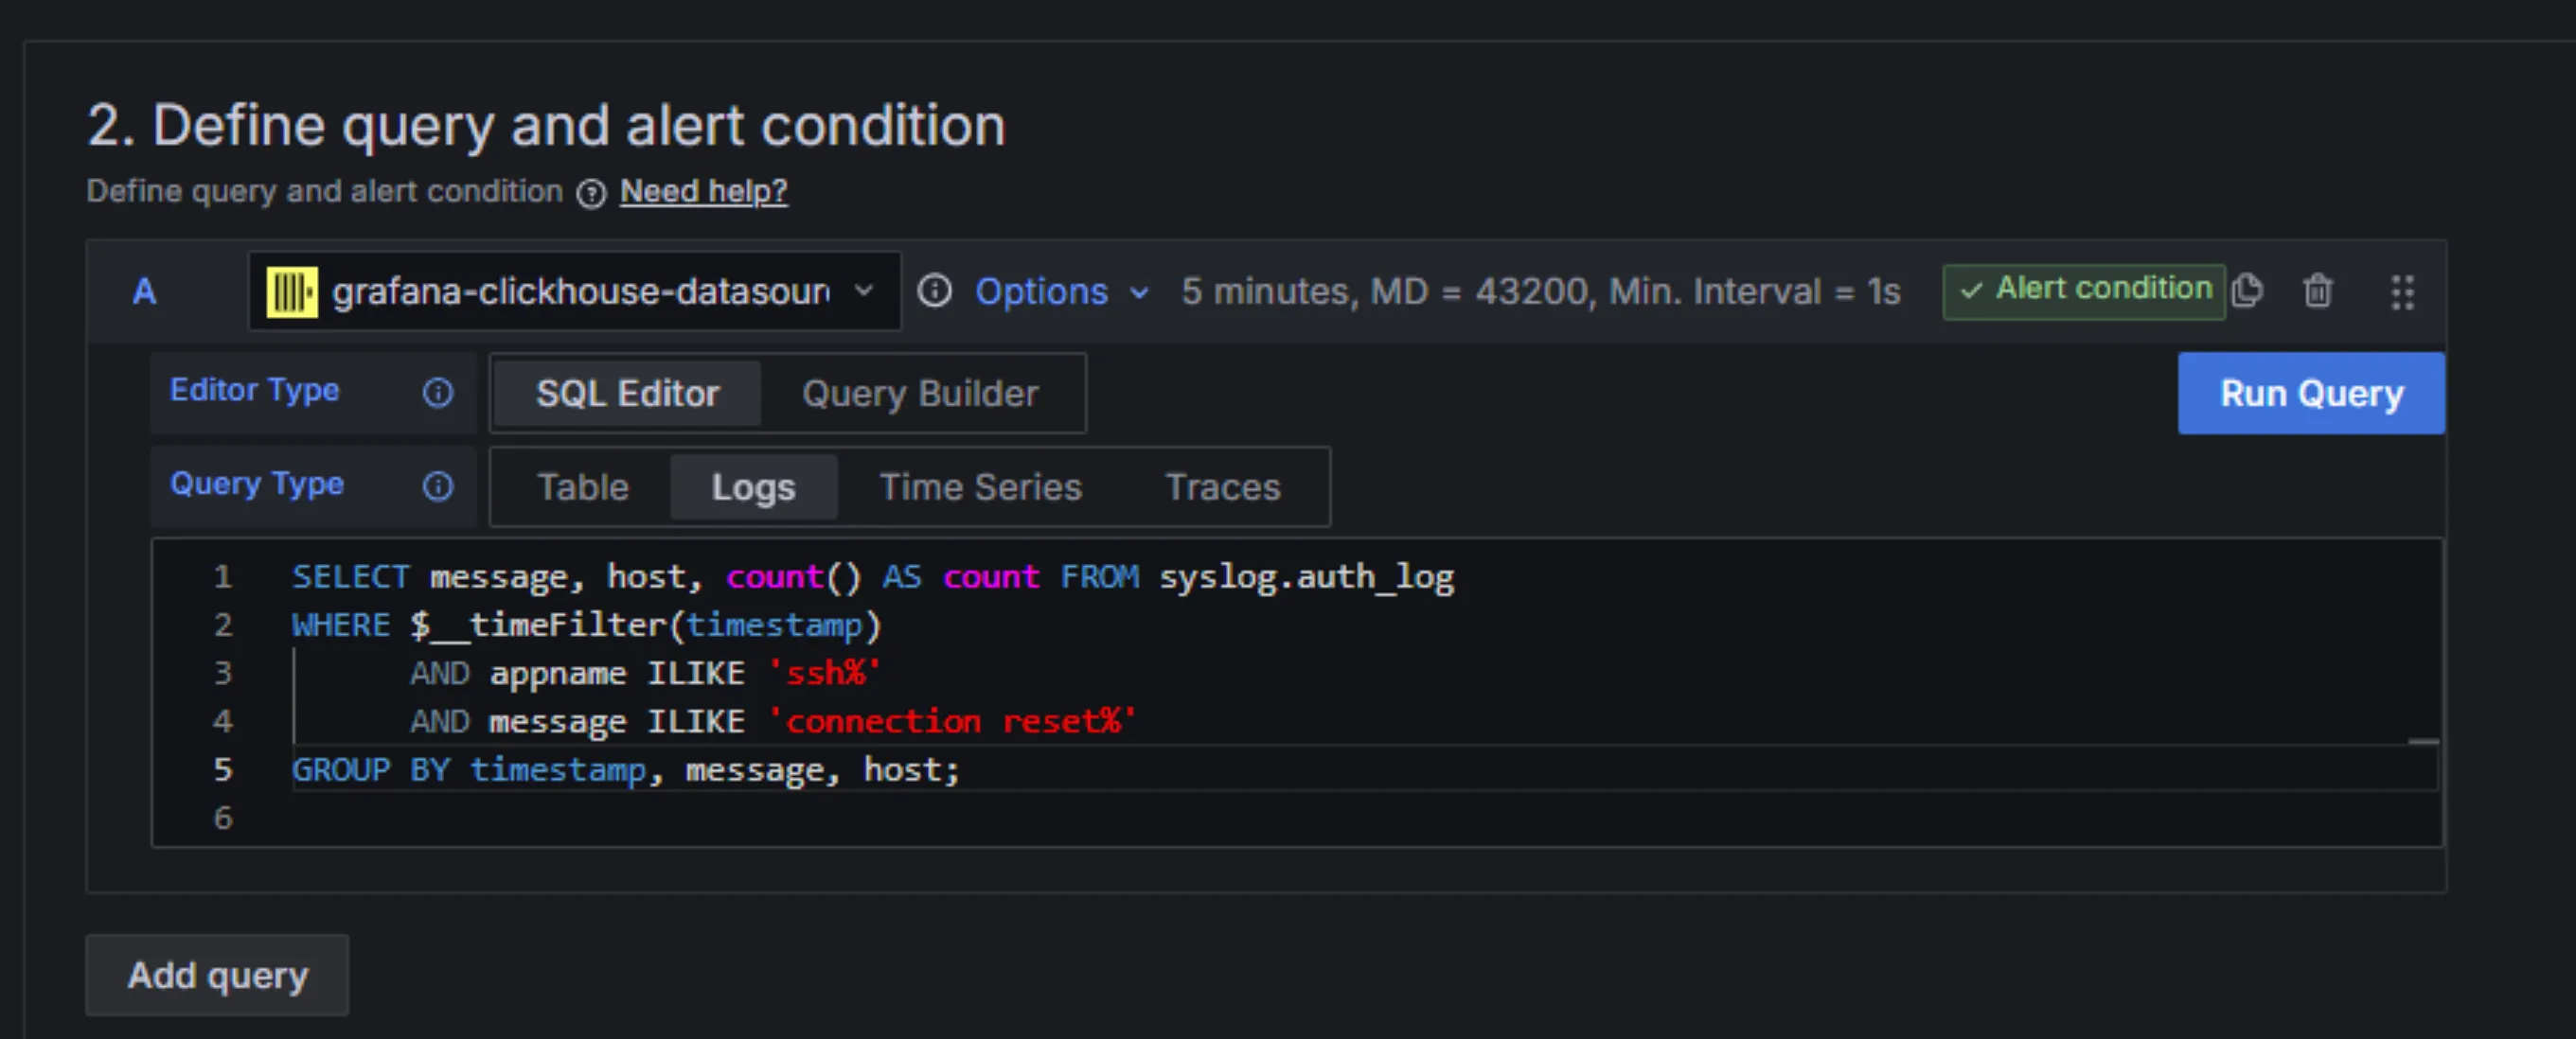
Such alerts are generated using special alert rules containing data source queries and some Grafana-specific parameters defining the behavior of these alerts.
For ClickHouse, just like with visualizations, either a query builder or an SQL editor can be used to query data for further evaluation using Grafana rules.
ClickHouse
ClickHouse supports a ton of FORMATs for input and output data.
Its CLI client allows to execute powerful queries and chain their input and output with other CLI tools using pipes in the shell. This is a very powerful approach to data manipulation.
For example, during an incident response, one can query some data, output it using a desired data format, pipe through gzip for compression, and redirect to a file. Our team uses this approach quite frequently, works like a charm.
There are several table engines implemented in ClickHouse, allowing for flexible data layout for your needs. Some are in-memory, some are based on persistent storage. Some store data as-is, and some perform aggregations to reduce disk usage.
There is a lot of parameters that can be tuned for specific workload. From per-column compression codec, to internal performance optimizations.
It has numerous integrations for data input and output.
$
clickhouse-client -u admin --ask-password --secure --host <REDACTED> -q "select * from nginx.access where client = '<REDACTED>' format CSVWithNames" | gzip > all_threat_actor.csv.gzThere’s also a very powerful CLI tool called clickhouse-local. It provides many capabilities of the ClickHouse Server without being required to run a server. This is useful when you need to manipulate or analyze very large datasets, and prepare them for usage with other software.
All of the queries can be piped with other tools as well.
$
clickhouse-local -q "describe file('all_threat_actor.csv.gz') format json" | jq '.data[] | select(.name == "site_name")'Further Improvements
Since this stack proved to be a suitable solution in our company’s case, the project will gradually evolve:
- A message queue, probably.
- Support for either high availability or replication.
- Ingest logs for other infra components, such as auth logs.
- Alerting for important events like auth failures.
- Various performance optimizations.
The End
Companies like Cloudflare, ClickHouse, and Uber also use ClickHouse as their observability data warehouse. Which means, with time there will be even more learning resources and tools.
Here are some cases:
I plan to write a follow-up article about NGINX observability using ClickHouse and Grafana with more in-depth walkthrough at some point in future when the project becomes more polished and functional. Stay tuned.
Every tool needs tuning and dedication. There’s no single silver bullet for every company and team, so compare all the options you have, and choose wisely based on your requirements.
Read Next
Rootless Docker in a Multi-user Environment — It's All About Context